
AT&T Quarterly Earnings: By the Numbers
Filed under: AT&T, Earnings

Although AT&T’s (T) revenue was up for the quarter that ended Sept. 30, 2014, it was up less than analysts expected, as subscribers opted to plug into the network with their own phones. Analysts have worried that AT&T’s option to allow consumers to bring their own devices might result in a glut of phones in the market. Also, fewer than expected sign-ups for its no contract Next wireless plans, which require customers to pay full price for their smartphones, caused the company to lower its revenue growth outlook for the year to 3 to 4 percent, down from an earlier forecast of 5 percent, all of which weighed on the performance of its stock.
AT&T’s release follows the earnings announcements from the following peers: Verizon Communications (VZ), America Movil (Telcel) (AMX) and Comcast Corporation (CMCSA).
Highlights
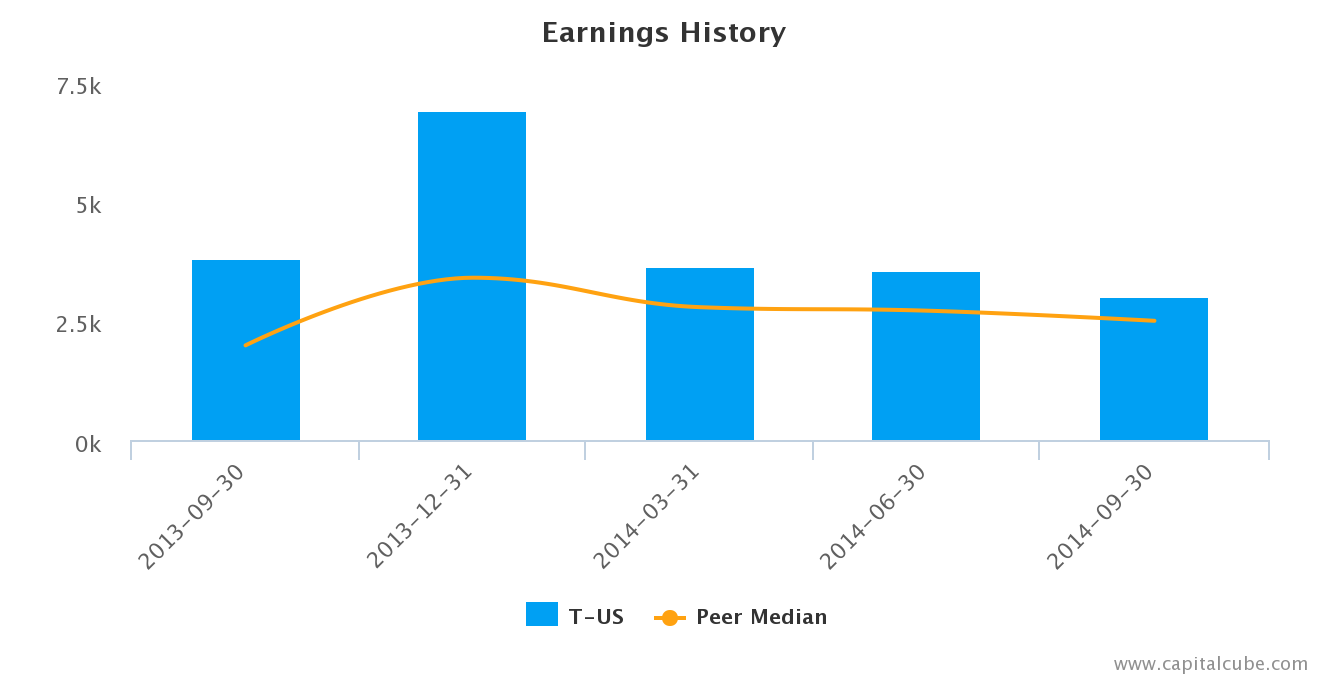
- Summary numbers: Revenues of $32.96 billion, Net Earnings of $3.0 billion and EPS of $0.58.
- Performance focus more on revenue than earnings: revenue increase 2.5 percent vs. lower earnings of -21.3 percent compared to the year-earlier period.
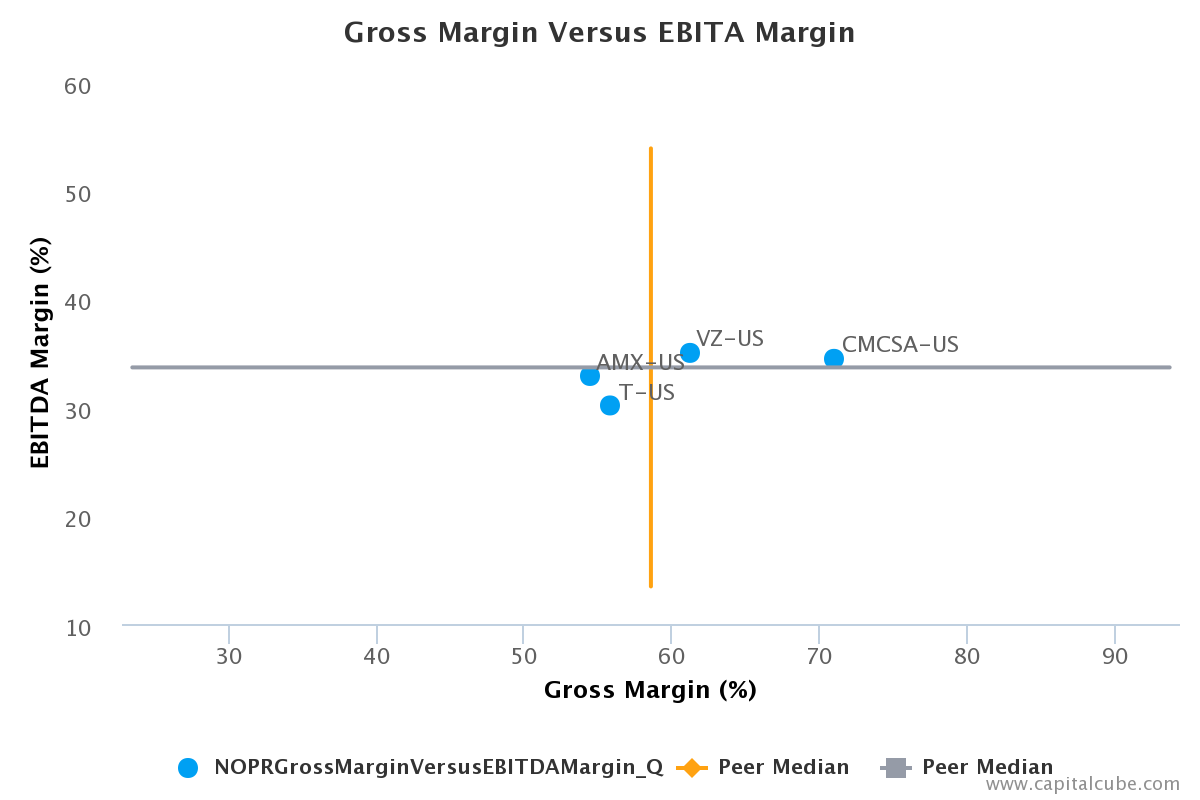
- Gross margins now 55.9 percent from 58.3 percent compared to the same period last year. Operating margins now 30.2 percent from 33.6 percent
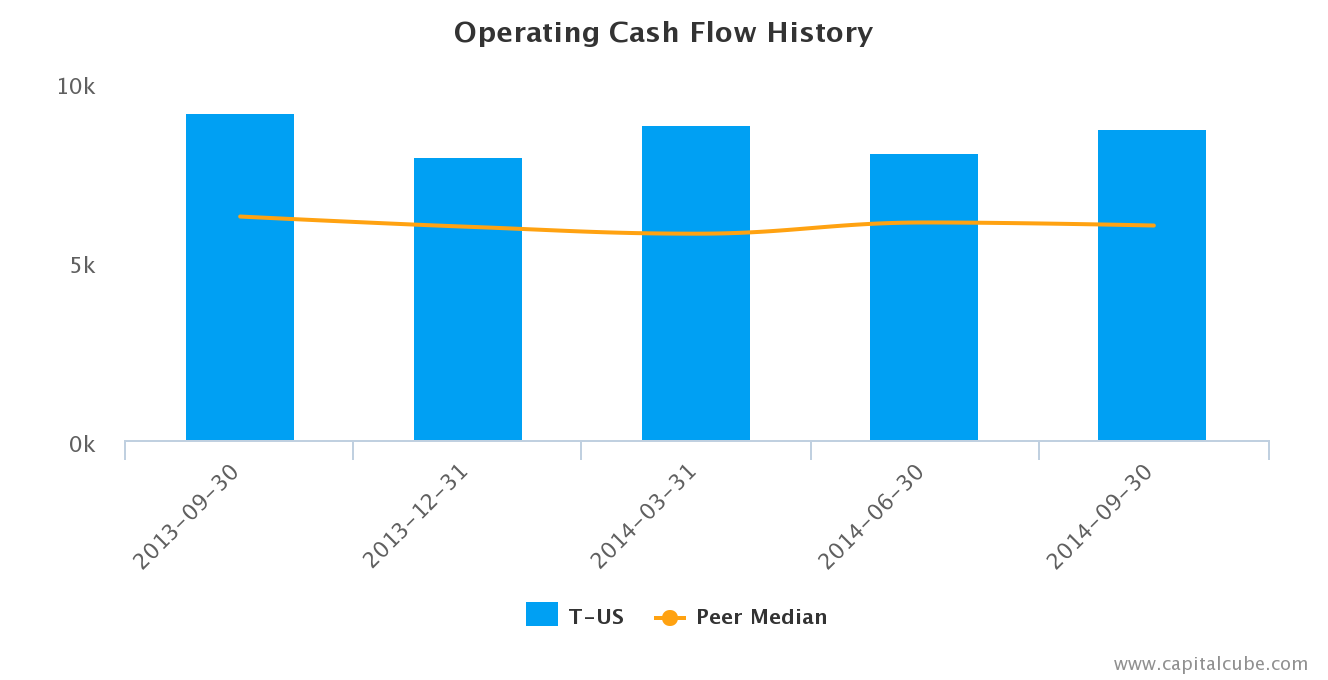
- Strong cash from operations of $8.7 billion with $3.5 billion in “free cash flow” (cash from operating activities minus capital expenditures)
- Earnings decline from operating margin decreases among other factors
The table below shows the preliminary results and recent trends for key metrics such as revenue growth and net income growth (See complete table at the end of this report):
| Q3 2013 | Q4 2013 | Q1 2014 | Q2 2014 | Q3 2014 | |
| Revenue Growth (YOY) | 2.2% | 1.8% | 3.6% | 1.6% | 2.5% |
| Earnings Growth (YOY) | 4.9% | 279.2% | -1.3% | -7.2% | -21.3% |
| Net Margin | 11.9% | 20.8% | 11.2% | 10.9% | 9.1% |
| EPS | $0.72 | $1.31 | $0.70 | $0.68 | $0.58 |
| Return on Equity | 17.7% | 31.1% | 16.0% | 15.4% | 12.9% |
| Return on Assets | 5.6% | 10.0% | 5.2% | 4.9% | 4.1% |
Market Share Versus Profits
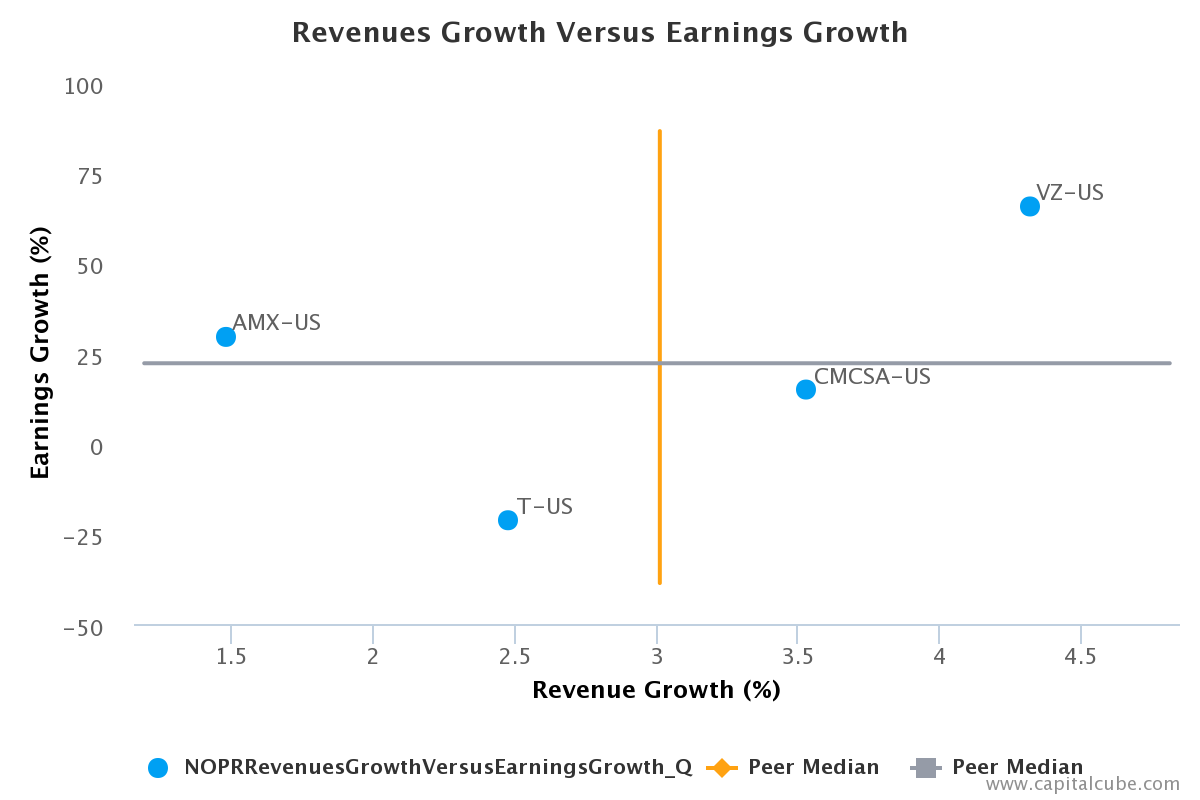
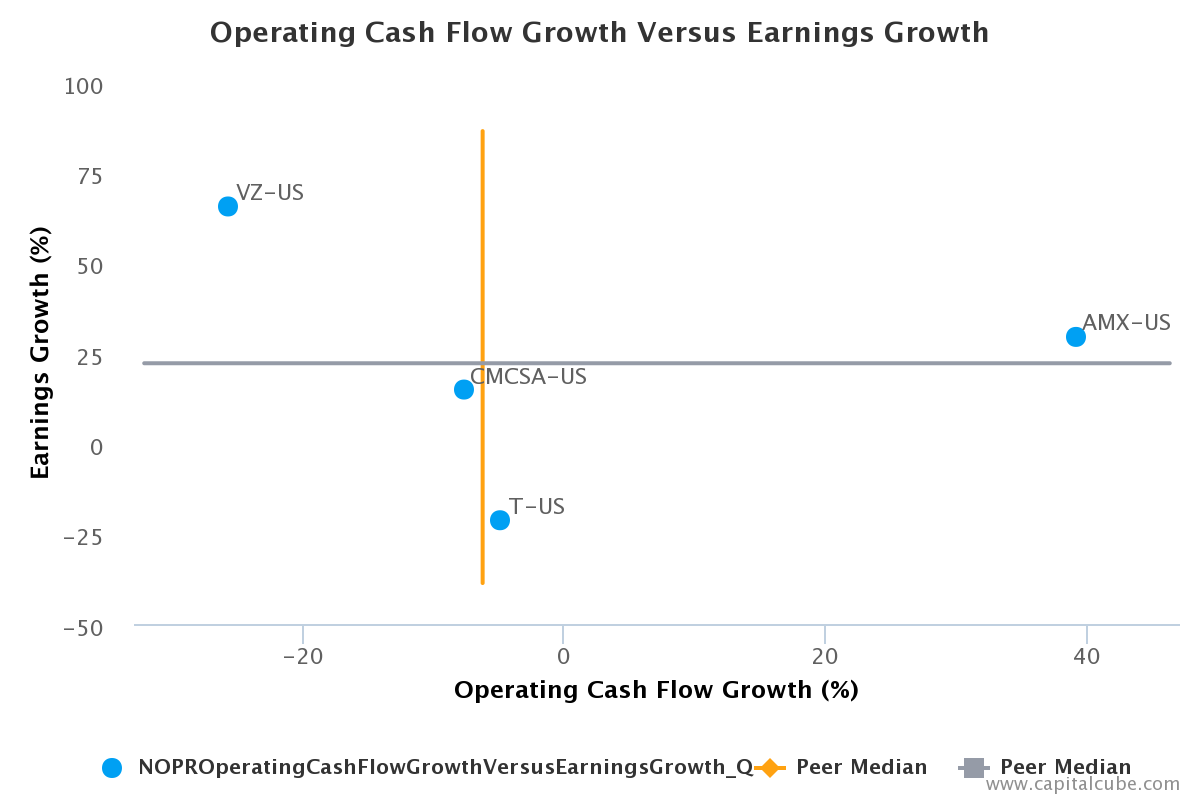
Companies sometimes focus on growing their top-line (Sales or Revenues) more than their bottom-line (Earnings or Net Income). Investors should look at revenue growth to understand a company’s ability to grow its market share, and earnings growth to look at the company’s ability to generate profits.
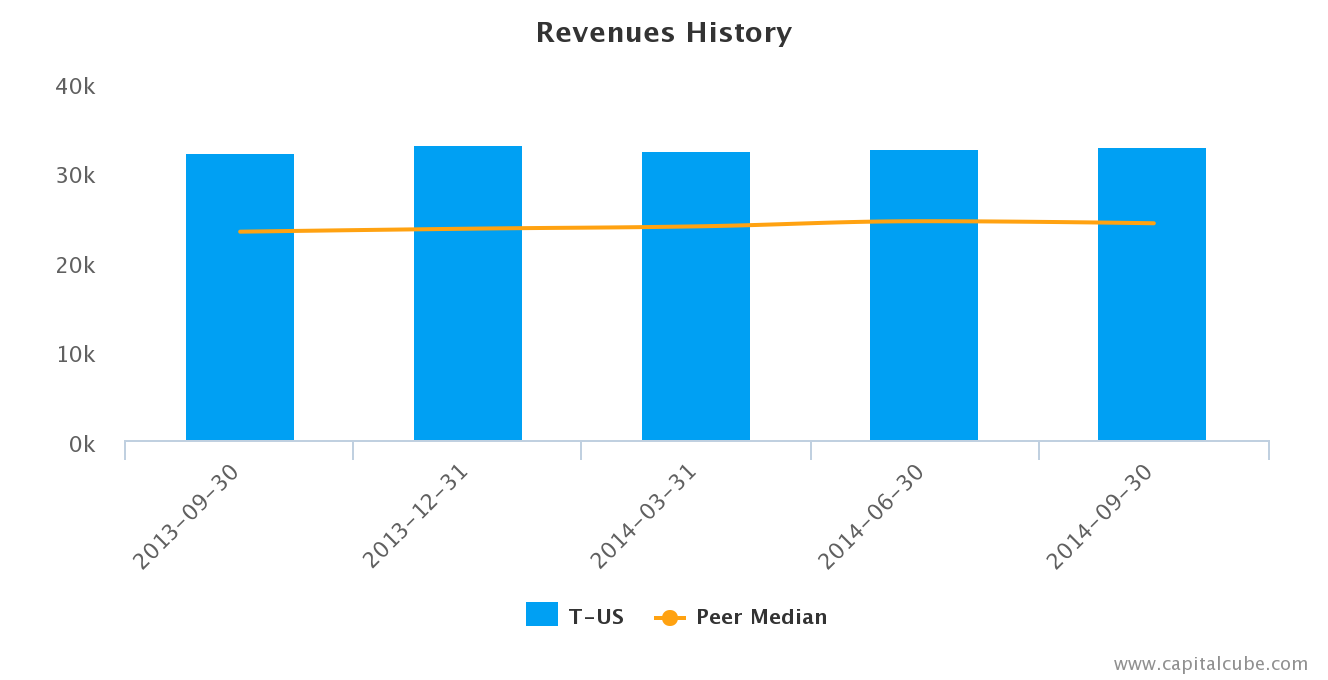
AT&T’s year-on-year change in revenue compared to the same period last year of 2.5 percent is better than its change in earnings which was -21.3 percent – suggesting perhaps that the company’s focus is on the top-line at the expense of bottom-line earnings. But more critically, this top-line performance is among the lowest thus far in its sector – inviting the potential of loss in market share as well this period. This trend can also be seen by tracking the performance of revenue and earnings from the immediate last quarter: revenues increased by 1.2 percent, while earnings declined by 15.4 percent compared to the second quarter.
Earnings Growth Analysis
The company’s year-on-year decline in earnings has been influenced by: (1) Decline in gross margins from 58.3 percent to 55.9 percent and (2) issues with cost controls. As a result, operating margins, (“EBITDA margins”), which help give the pulse of a company’s profitability and operating efficiency, were reduced from 33.6 percent to 30.2 percent in this period. For comparison, in the second quarter, gross margins were 56.4 percent and operating margins 31.2 percent.
Cash Versus Earnings
Companies often post earnings numbers that are influenced by non-cash activities. One way to gauge the quality of the announced earnings number is to determine if the earnings can be sustained over a period of time. One measure of this is the comparison of the growth in earnings against the growth in operating cash flows. In general, an earnings growth rate higher than the operating cash flow growth rate implies a higher proportion of non-operating and even one-time activities, which are typically not sustainable over long periods.
AT&T’s year-on-year change in Operating Cash Flow of -4.8 percent exceeds its change in earnings, suggesting that the company might have been able to declare a higher earnings number. However, a cautionary note is in order, as this change in operating cash flow is lower than average among the announced results thus far of its peer group.
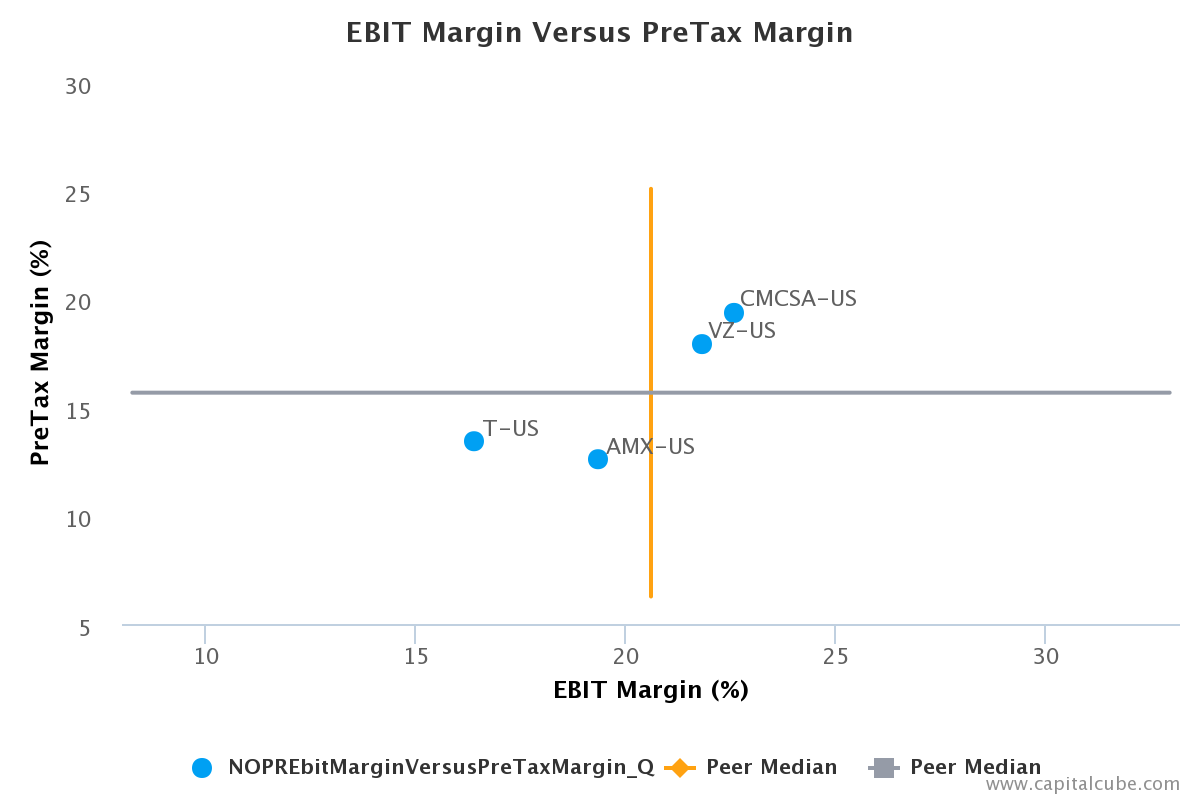
Unusual Items
The company’s decline in earnings has been influenced by the following factors: (1) Decline in EBIT margins from 19.2 percent to 16.4 percent and (2) unusual items that decreased pretax margins from 17.1 percent to 13.4 percent.
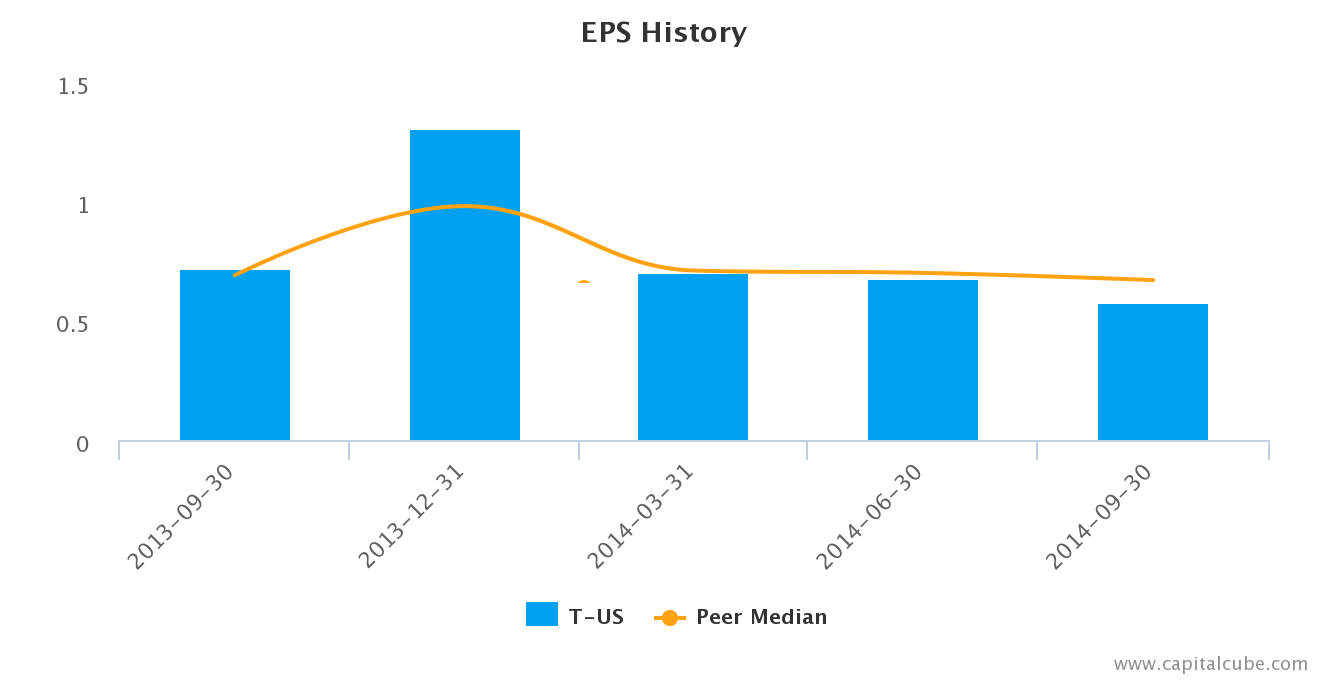
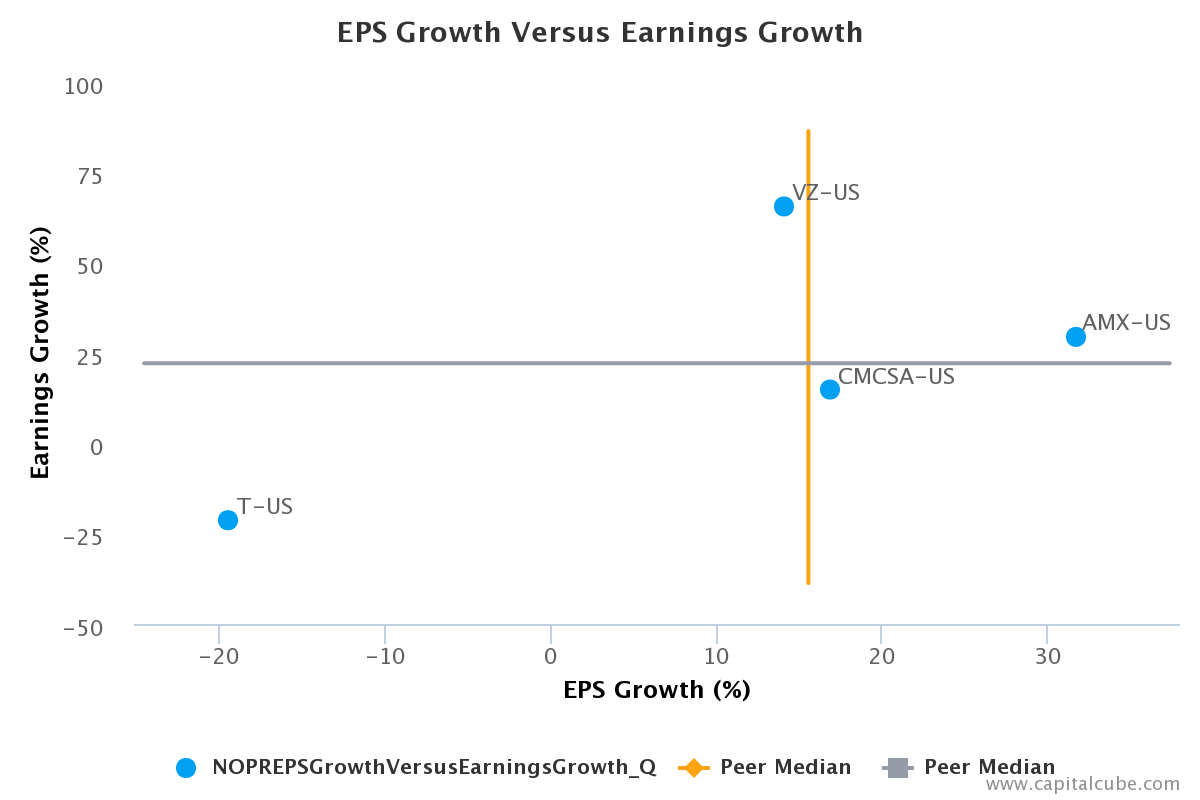
EPS Growth Versus Earnings Growth
AT&T’s year-on-year change in Earnings per Share (EPS) of -19.4 percent is better than its change in earnings of -21.3 percent. In addition, this decline in earnings is greater than the peer average among the declared results thus far in its peer group, suggesting that the company is losing ground in generating profits in this group.
Supporting Data
The table below shows the preliminary results along with the recent trend for revenues, net income and other relevant metrics:
| Q3 2013 | Q4 2013 | Q1 2014 | Q2 2014 | Q3 2014 | |
| Revenue Growth (YOY) | 2.2% | 1.8% | 3.6% | 1.6% | 2.5% |
| Peer Average Revenue Growth (YOY) | 5.7% | 1.3% | 4.2% | 3.6% | 3.0% |
| Earnings Growth (YOY) | 4.9% | 279.2% | -1.3% | -7.2% | -21.3% |
| Peer Average Earnings Growth (YOY) | 21.7% | 100.9% | 20.1% | 11.5% | 22.2% |
| Operating Cash Flow Growth (YOY) | -12.0% | -19.8% | 4.0% | -30.2% | -7.5% |
| Peer Average Operating Cash Flow Growth (YOY) | 2.2% | 5.7% | 0.6% | -11.3% | 0.5% |
| Gross Margin | 58.3% | 63.1% | 59.0% | 56.4% | 55.9% |
| Peer Average Gross Margin | 61.1% | 62.3% | 61.3% | 59.0% | 58.5% |
| Operating Margin | 33.6% | 51.0% | 33.5% | 31.2% | 30.2% |
| Peer Average Operating Margin | 35.0% | 33.0% | 35.4% | 32.5% | 33.7% |
| Net Margin | 11.9% | 20.8% | 11.2% | 10.9% | 9.1% |
| Peer Average Net Margin | 9.0% | 13.5% | 11.3% | 10.8% | 10.5% |
| EPS | $0.72 | $1.31 | $0.70 | $0.68 | $0.58 |
| Peer Average EPS | $0.69 | $0.98 | $0.71 | $0.70 | $0.67 |
| Return on Equity | 17.7% | 31.1% | 16.0% | 15.4% | 12.9% |
| Peer Average Return on Equity | 15.8% | 26.3% | 22.4% | 20.8% | 25.3% |
| Return on Assets | 5.6% | 10.0% | 5.2% | 4.9% | 4.1% |
| Peer Average Return on Assets | 5.0% | 6.9% | 5.8% | 5.1% | 5.8% |
Company Profile
AT&T, Inc. provides telecommunication services and products, including wireless communications, local exchange services, long-distance services, data/broadband and Internet services, video services, telecommunications equipment, managed networking and wholesale services. It operates business through three reportable segments: Wireless, Wireline and Other. The Wireless segment operates comprehensive range of high-quality nationwide wireless voice and data communications services in a variety of pricing plans, including postpaid and prepaid service plans. It also sells handsets, wirelessly enabled computers and personal computer wireless data cards manufactured by various suppliers for use with voice and data services. The Wireline segment provides both retail and wholesale communication services domestically and internationally. Its wireline services into three product-based categories: voice, data and other. The Other segment includes equipment, outsourcing, government-related services, customer information services and satellite video services. The security service includes business continuity and disaster recovery services as well as premise and network based security products. The company was founded in 1876 and is headquartered in Dallas, TX.
CapitalCube does not own any shares in the stocks mentioned and focuses solely on providing unique fundamental research and analysis on approximately 50,000 stocks and ETFs globally. Try any of our analysis, screener or portfolio premium services free for 7 days. To get a quick preview of our services, check out our free quick summary analysis of AT&T.
Permalink | Email this | Linking Blogs | Comments
http://www.dailyfinance.com/on/atandt-quarterly-earnings-by-the-numbers/